
10 Clinical Operations Copilot Metrics to Track for Success
Introduction
In the complex realm of clinical research, identifying and analyzing key metrics is crucial for achieving successful outcomes. As clinical trials grow increasingly intricate, pinpointing the right operational metrics is vital for optimizing study design and recruitment strategies. The increasing complexity of clinical trials presents challenges in identifying the most effective metrics for success. Stakeholders must identify the most impactful metrics that drive trial success. This article examines ten critical clinical operations metrics that streamline processes and ensure trials meet their objectives efficiently.
InnovoCommerce: Optimizing Study Design Metrics
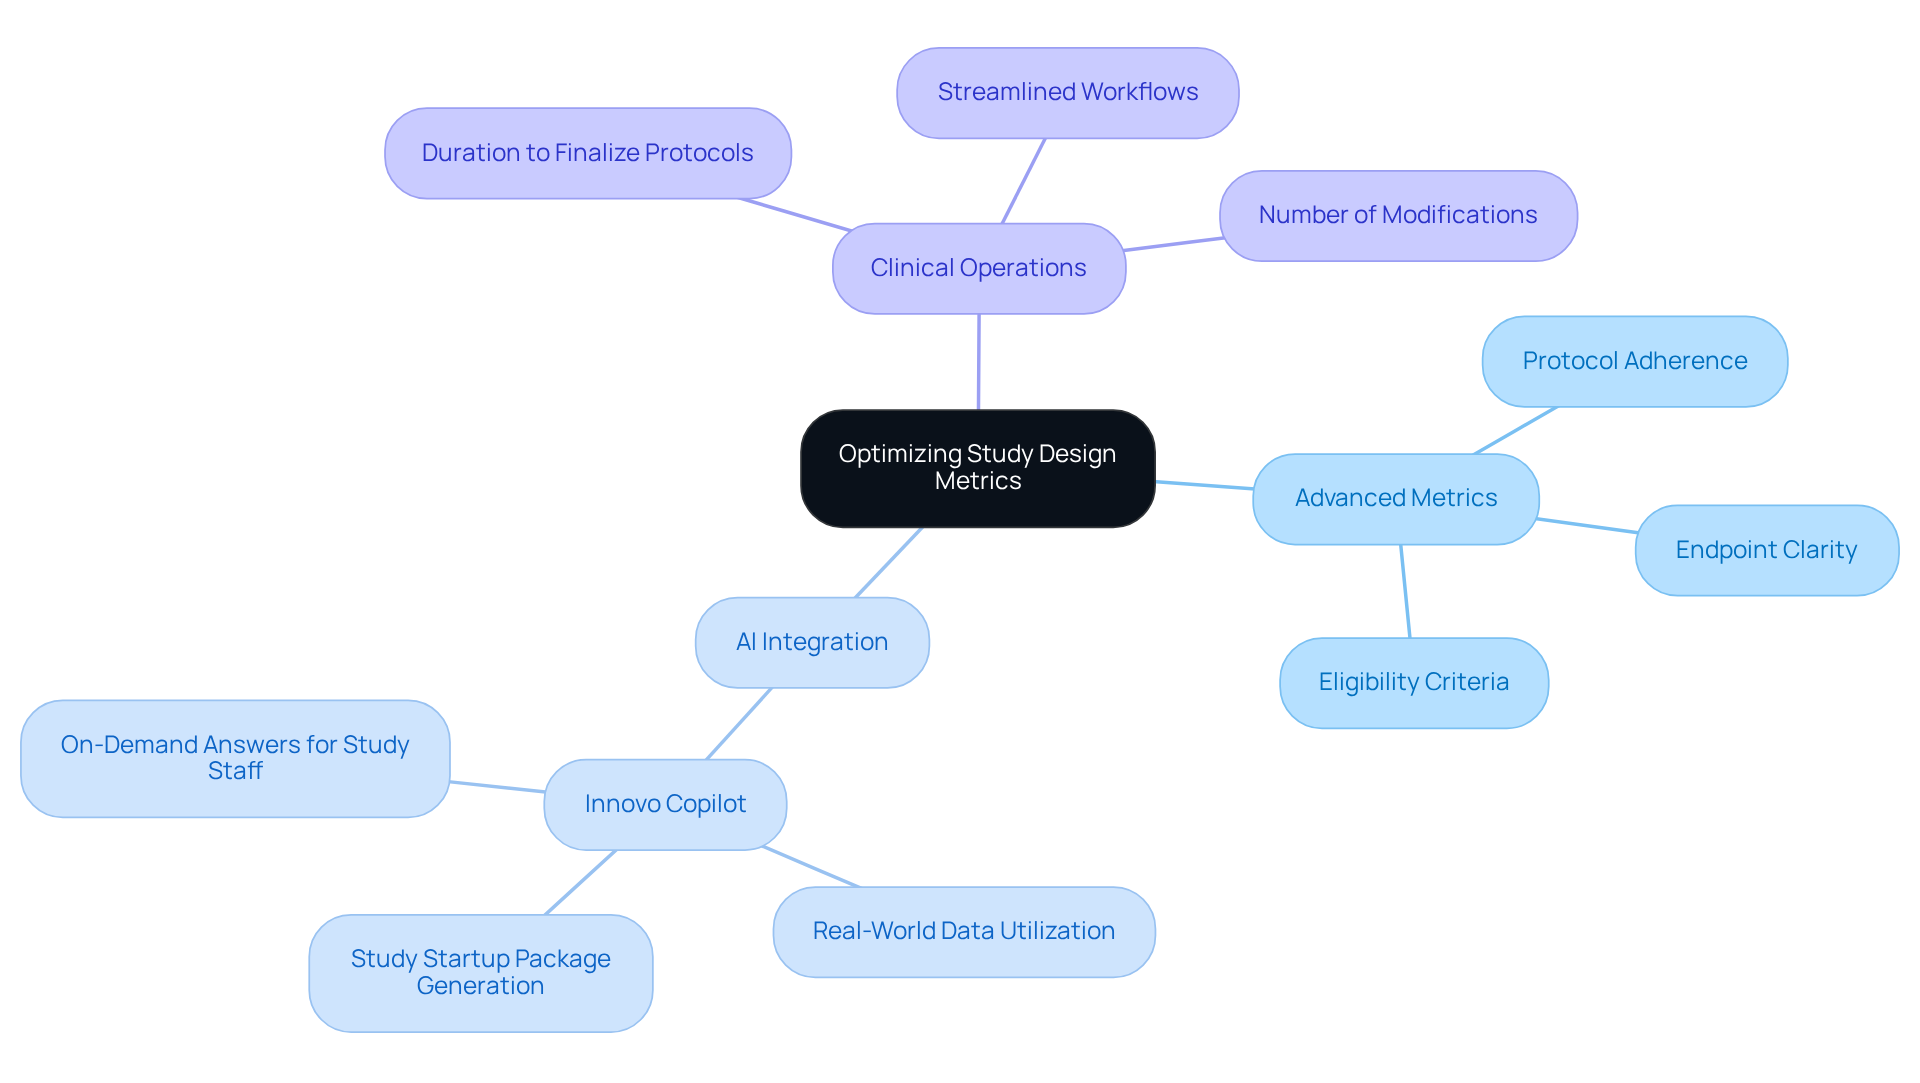
InnovoCommerce addresses the complexities of research design by leveraging advanced metrics and AI technology. The platform utilizes clinical operations copilot metrics to track and refine research design, focusing on advanced metrics such as:
- Protocol adherence
- Endpoint clarity
- Eligibility criteria
Supported by Innovo Copilot, a Clinical AI Assistant, the platform leverages real-world data to improve the precision of research designs, aligning them with specific research objectives. This AI-driven solution facilitates the bulk generation of study startup packages and provides on-demand answers to study staff regarding training, documents, and more, further streamlining operations.
Moreover, integrating with eClinical systems streamlines workflows, thereby enhancing overall efficiency. Metrics such as the duration required to finalize protocols and the number of modifications made after approval are essential clinical operations copilot metrics to track for evaluating the effectiveness of the design process. Ultimately, this approach not only enhances research efficiency but also elevates the quality of outcomes in clinical studies.
Enrollment Metrics: Tracking Recruitment Success
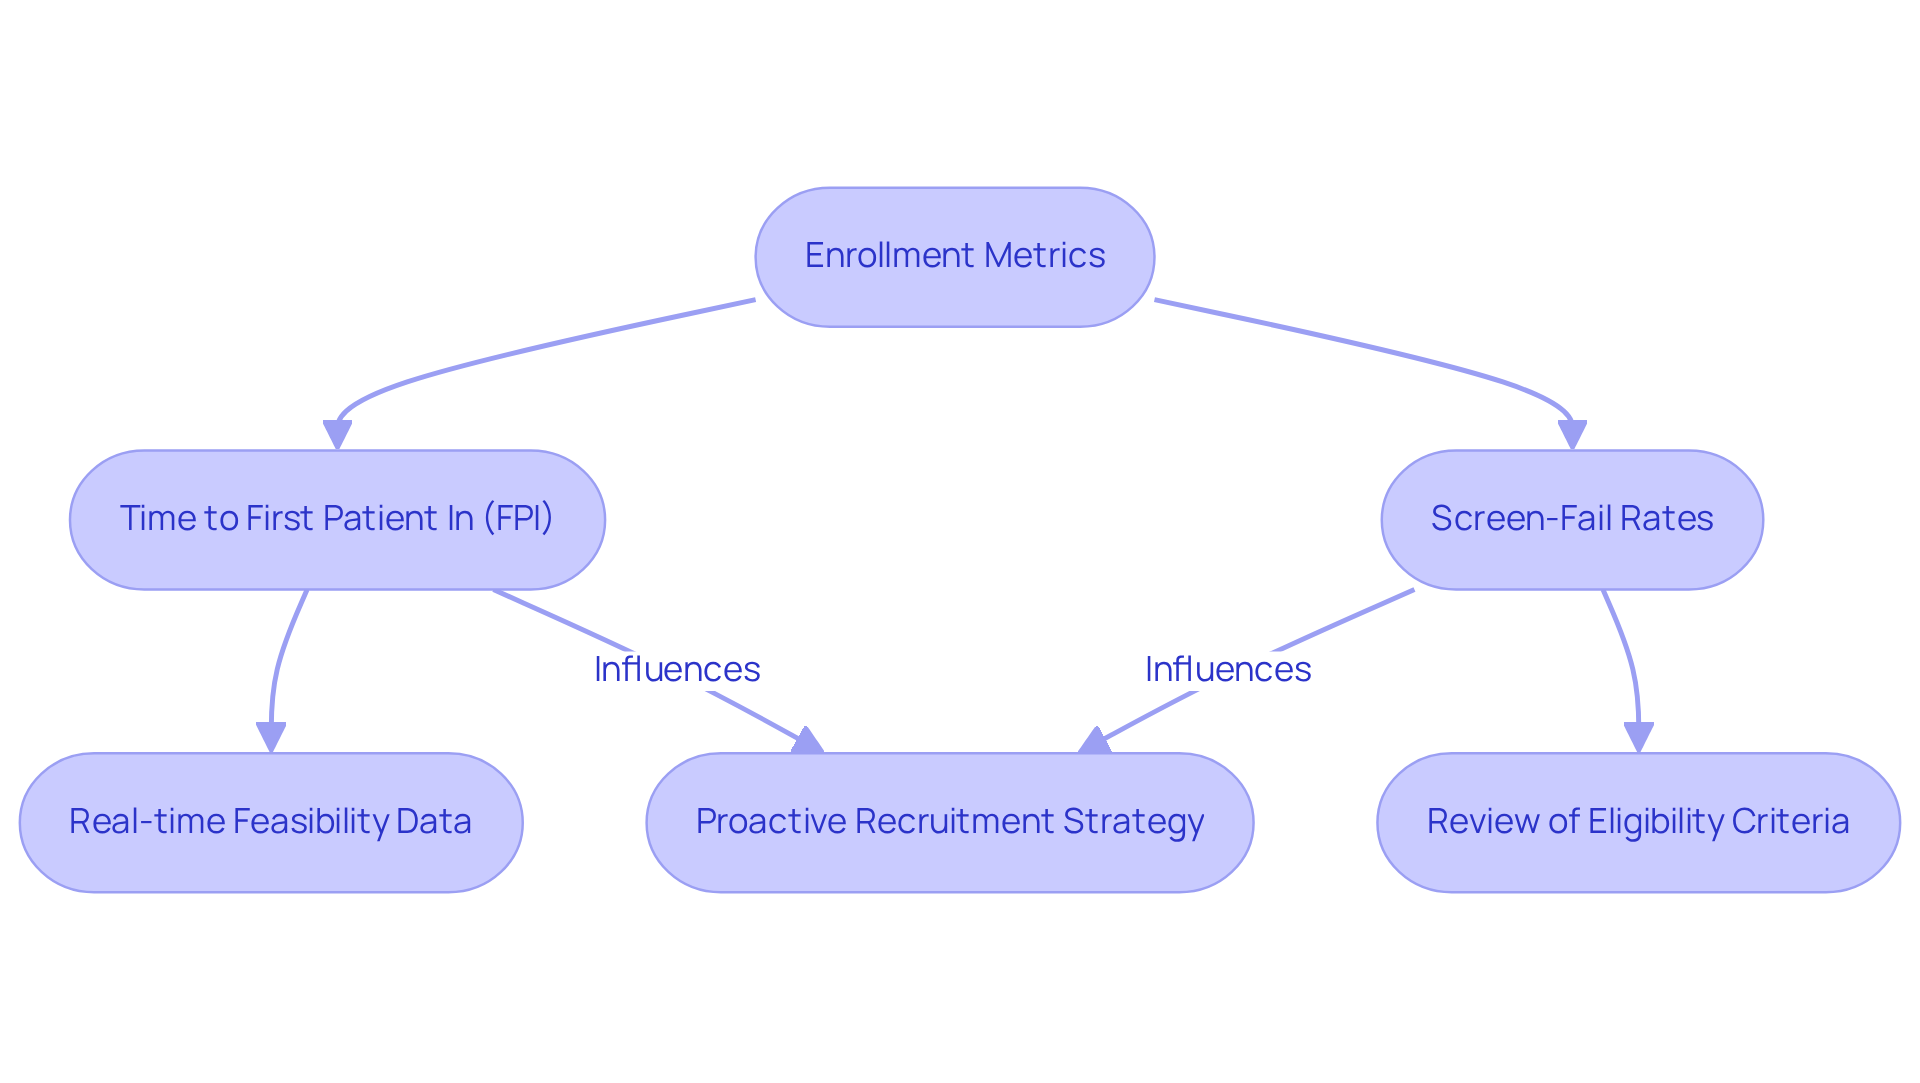
Essential enrollment indicators, such as time to first patient in (FPI) and screen-fail rates, are critical for assessing recruitment effectiveness in clinical studies. In 2026, the average time to FPI will be closely monitored, as sponsors increasingly demand real-time feasibility data before site activation. High screen-fail rates indicate potential flaws in eligibility criteria, complicating recruitment efforts and necessitating a thorough review of strategies to improve participant engagement.
For instance, BEKhealth's platform can identify ten times more qualified patients and enroll them at double the speed, effectively tackling recruitment challenges. Furthermore, as participant enrollment progresses, new indicators emphasizing pace, precision, and inclusiveness are emerging, advancing beyond conventional measures. This evolution in recruitment metrics necessitates a proactive and comprehensive strategy to ensure successful participant enrollment in future studies.
Study Startup Metrics: Monitoring Activation Progress
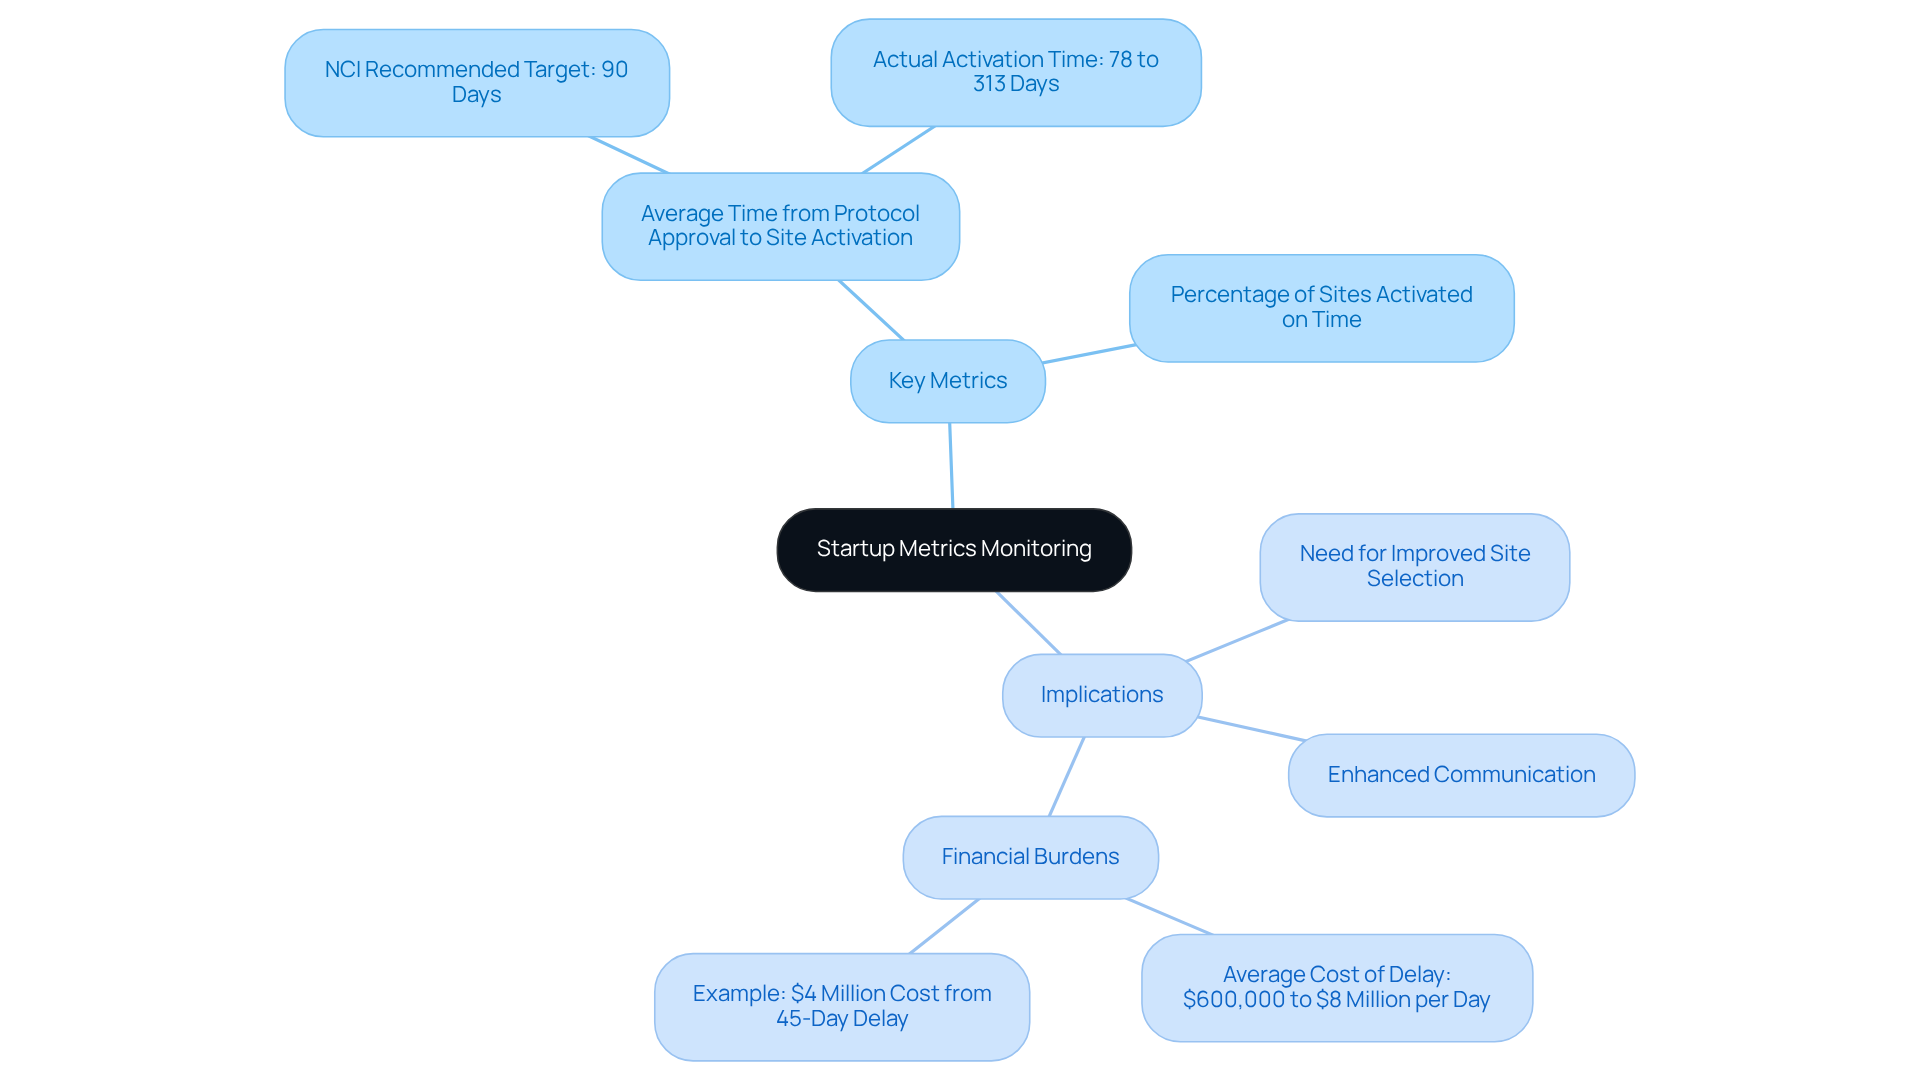
Monitoring research startup indicators is essential for ensuring the timely initiation of clinical trials. Key metrics include:
- The average time from protocol approval to site activation
- The percentage of sites activated on time
In 2026, the average activation time at NCI-designated cancer centers ranged from 78 to 313 days, far surpassing the recommended target of 90 days. This discrepancy underscores the need for improved site selection and enhanced communication with site staff to mitigate delays.
For instance, a global Phase III oncology trial experienced an average site activation delay of 45 days, extending the timeline by six months and incurring an additional cost of $4 million. These examples highlight the substantial financial burdens resulting from inefficiencies in the startup process.
By closely observing the clinical operations copilot metrics to track, stakeholders can pinpoint bottlenecks and apply strategies to enhance operations, ultimately speeding up patient access to investigational therapies and improving study outcomes. Addressing these inefficiencies is vital for optimizing trial operations and enhancing patient access to new therapies.
Representative Sampling Metrics: Ensuring Data Quality
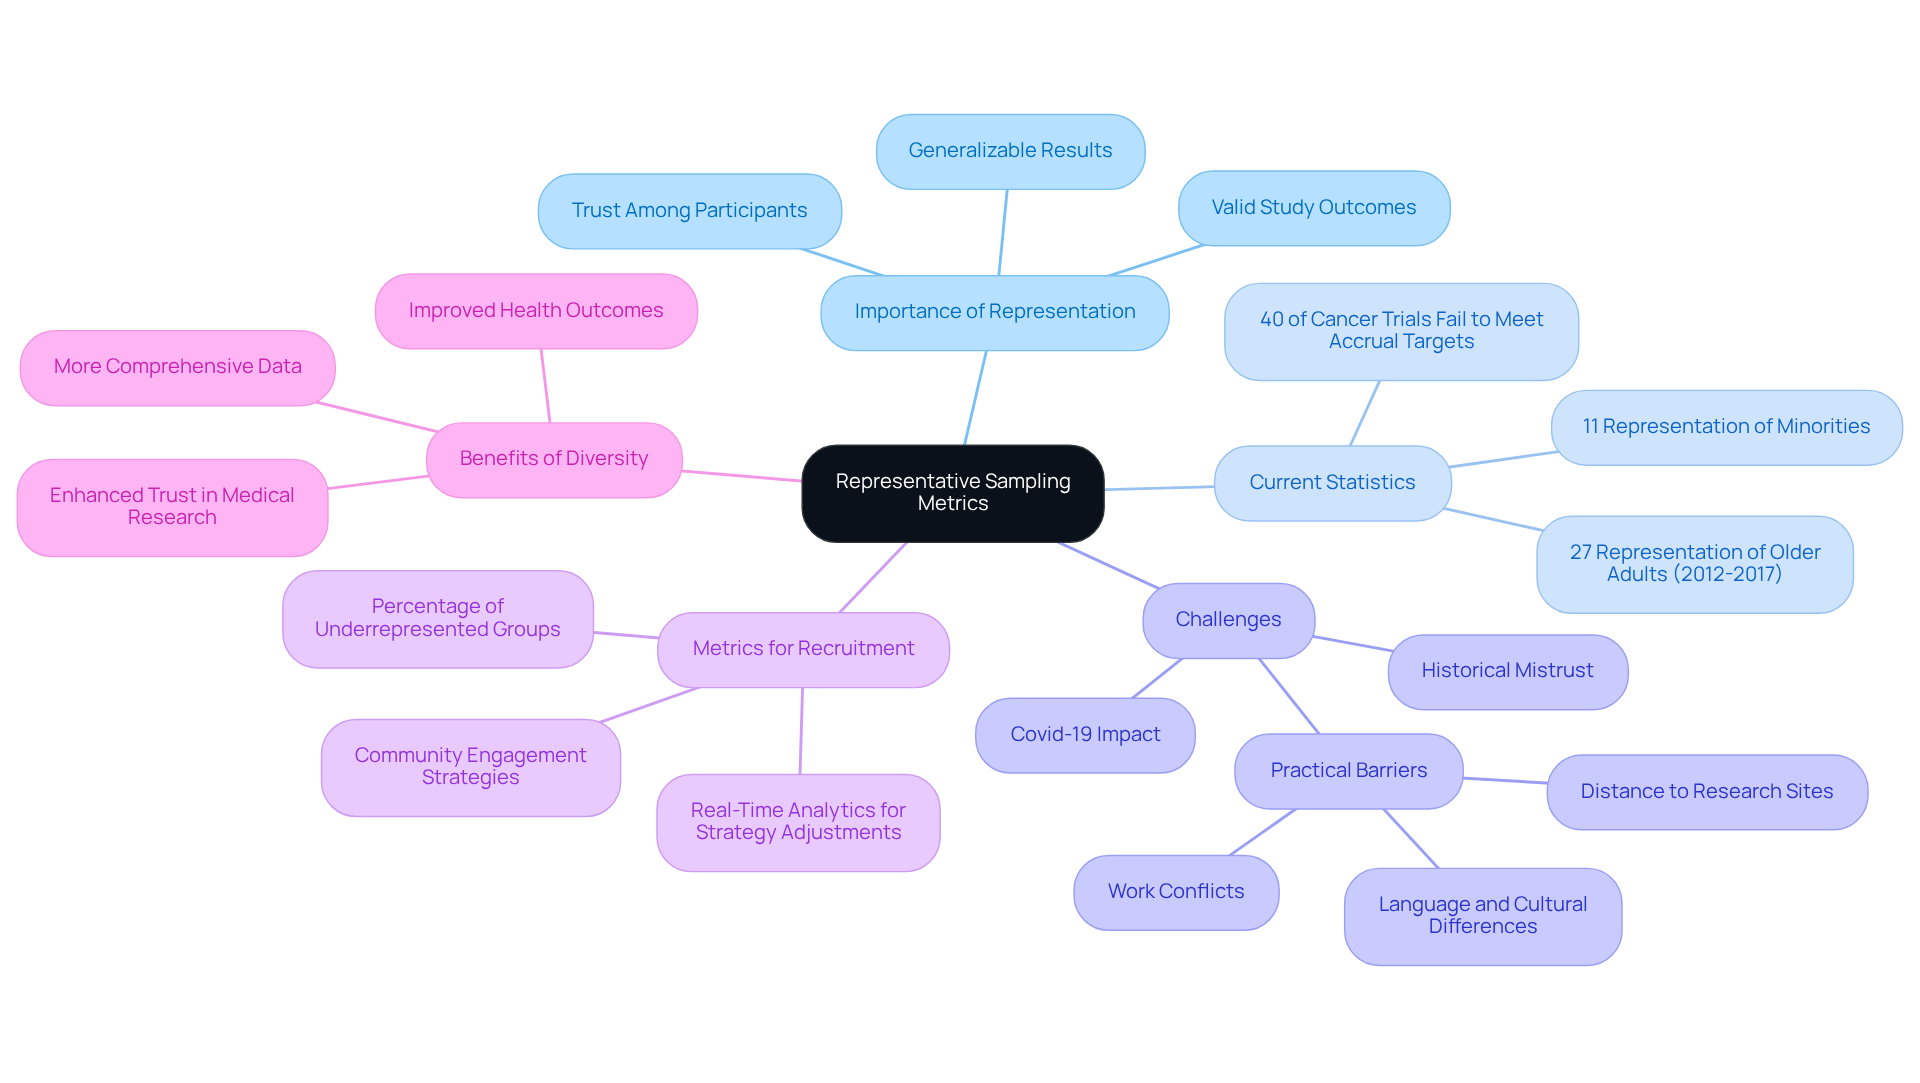
Ensuring that study samples accurately reflect the target population is critical for the validity of research outcomes. This alignment is crucial for valid study outcomes, allowing researchers to draw significant conclusions relevant to diverse groups. Current statistics indicate that only 11% of clinical studies adequately represent minority and racial groups, underscoring a significant gap in demographic alignment. This lack of representation has historical roots and has been worsened by challenges like the Covid-19 pandemic, emphasizing the need for inclusive recruitment strategies.
Metrics such as the percentage of underrepresented groups within the sample can inform clinical operations copilot metrics to track recruitment strategies, ultimately enhancing diversity and improving data quality. For example, case studies have demonstrated that experiments successfully incorporating diverse populations not only produced more generalizable outcomes but also cultivated trust among participants, which is essential for continued involvement. As highlighted by the Clinical Trials Transformation Initiative (CTTI), enrolling diverse populations leads to more precise and generalizable study results, enhancing our understanding of the safety and efficacy of investigational medical products.
By prioritizing representative sampling and addressing practical barriers to participation, development teams can ensure that their findings are robust and applicable across various demographics, leading to better health outcomes for all. Addressing these challenges not only enhances the robustness of findings but also promotes equitable health outcomes across diverse populations.
Staff Time Metrics: Evaluating Resource Allocation
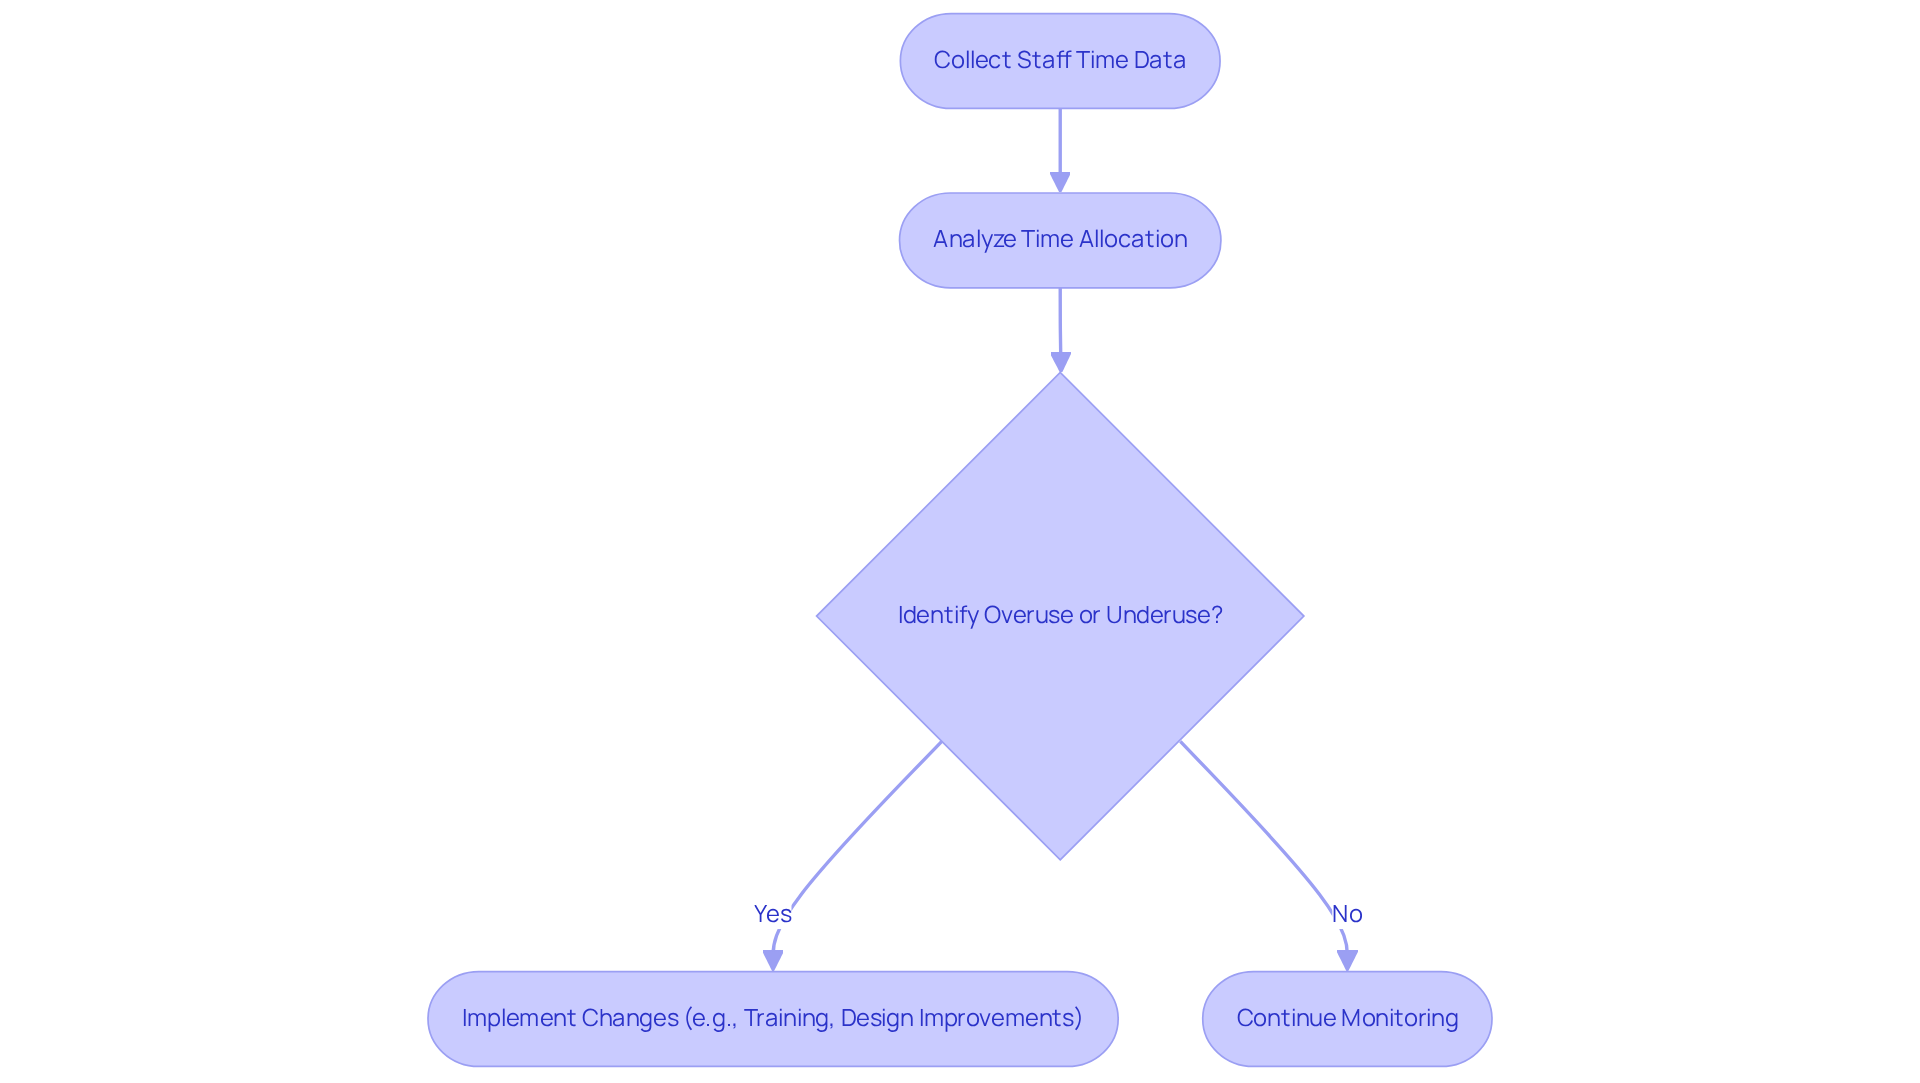
Accurate staff time measurements are crucial for optimizing resource distribution in research studies, encompassing both the average hours spent on each task and the total time dedicated to every phase of the study. Project managers can pinpoint areas of resource overuse or underuse through careful analysis of these measurements.
For instance, if a significant amount of time is allocated to protocol amendments, it may indicate the need for clearer initial designs or improved staff training. As the research landscape evolves in 2026, understanding these measurements will be vital for improving operational efficiency and aligning resources with study objectives.
Case studies illustrate that organizations implementing robust employee time measurements often see significant improvements in management processes, leading to enhanced decision-making and productivity. Ultimately, effective time measurement can transform research management, paving the way for more successful outcomes.
Accrual Performance Metrics: Analyzing Department Contributions
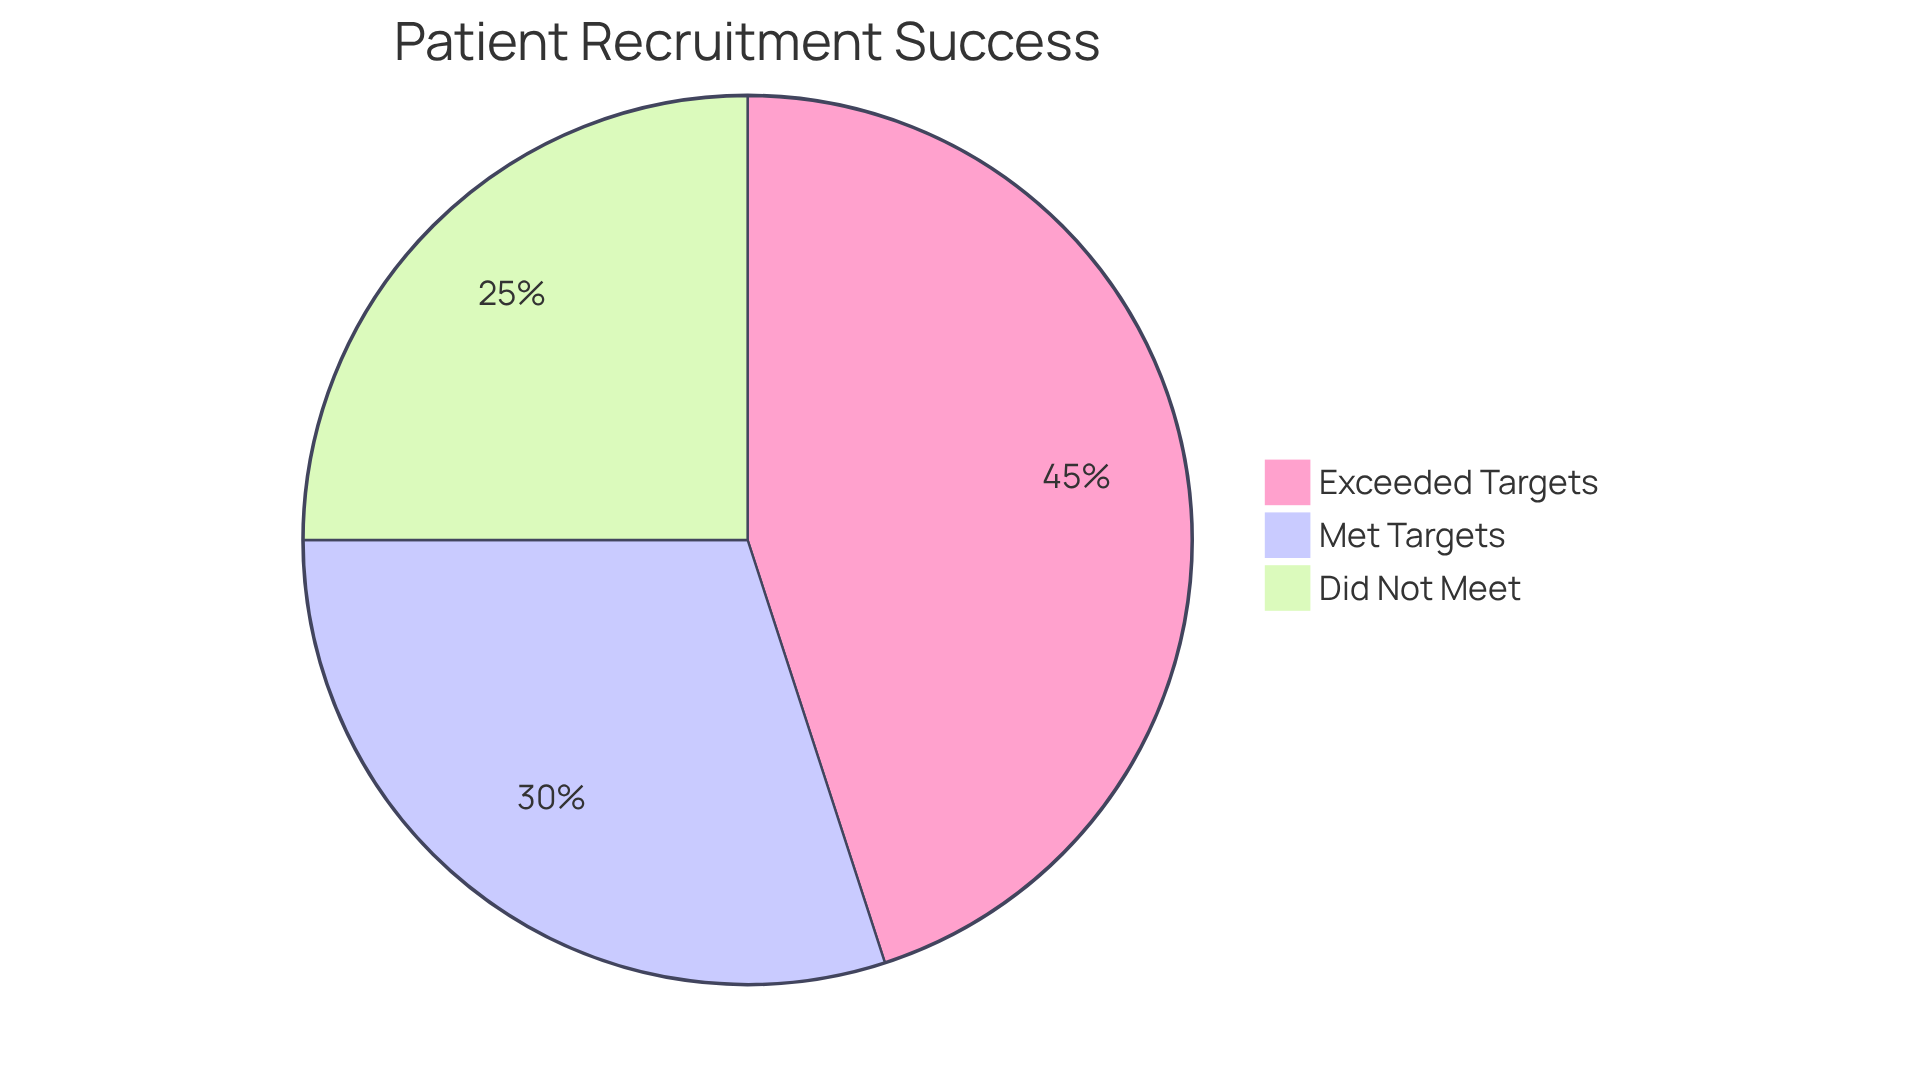
Accrual performance indicators serve as vital metrics for evaluating the effectiveness of patient recruitment in clinical studies. These metrics encompass the number of patients recruited by each department and the enrollment rate per site. Through a detailed analysis of these figures, project managers identify departments that excel in meeting accrual targets and those that necessitate additional resources or support. For instance, departments that consistently surpass their recruitment goals can provide valuable insights and best practices that can be disseminated throughout the organization. Sharing successful methods enhances study efficiency and promotes continuous improvement in patient recruitment.
Recent data indicates that approximately 80% of clinical studies face significant delays or closures due to recruitment challenges, with 11% of sites failing to enroll a single patient. This highlights the essential role of effective recruitment strategies in sustaining study viability. Moreover, a case analysis showed that 55% of ended studies mentioned low enrollment as the main cause for cessation, underscoring the critical need for effective recruitment strategies. By leveraging insights from departmental performance, organizations can enhance their recruitment strategies, ultimately resulting in more successful research endeavors.
Engagement Metrics: Enhancing Site and Participant Involvement
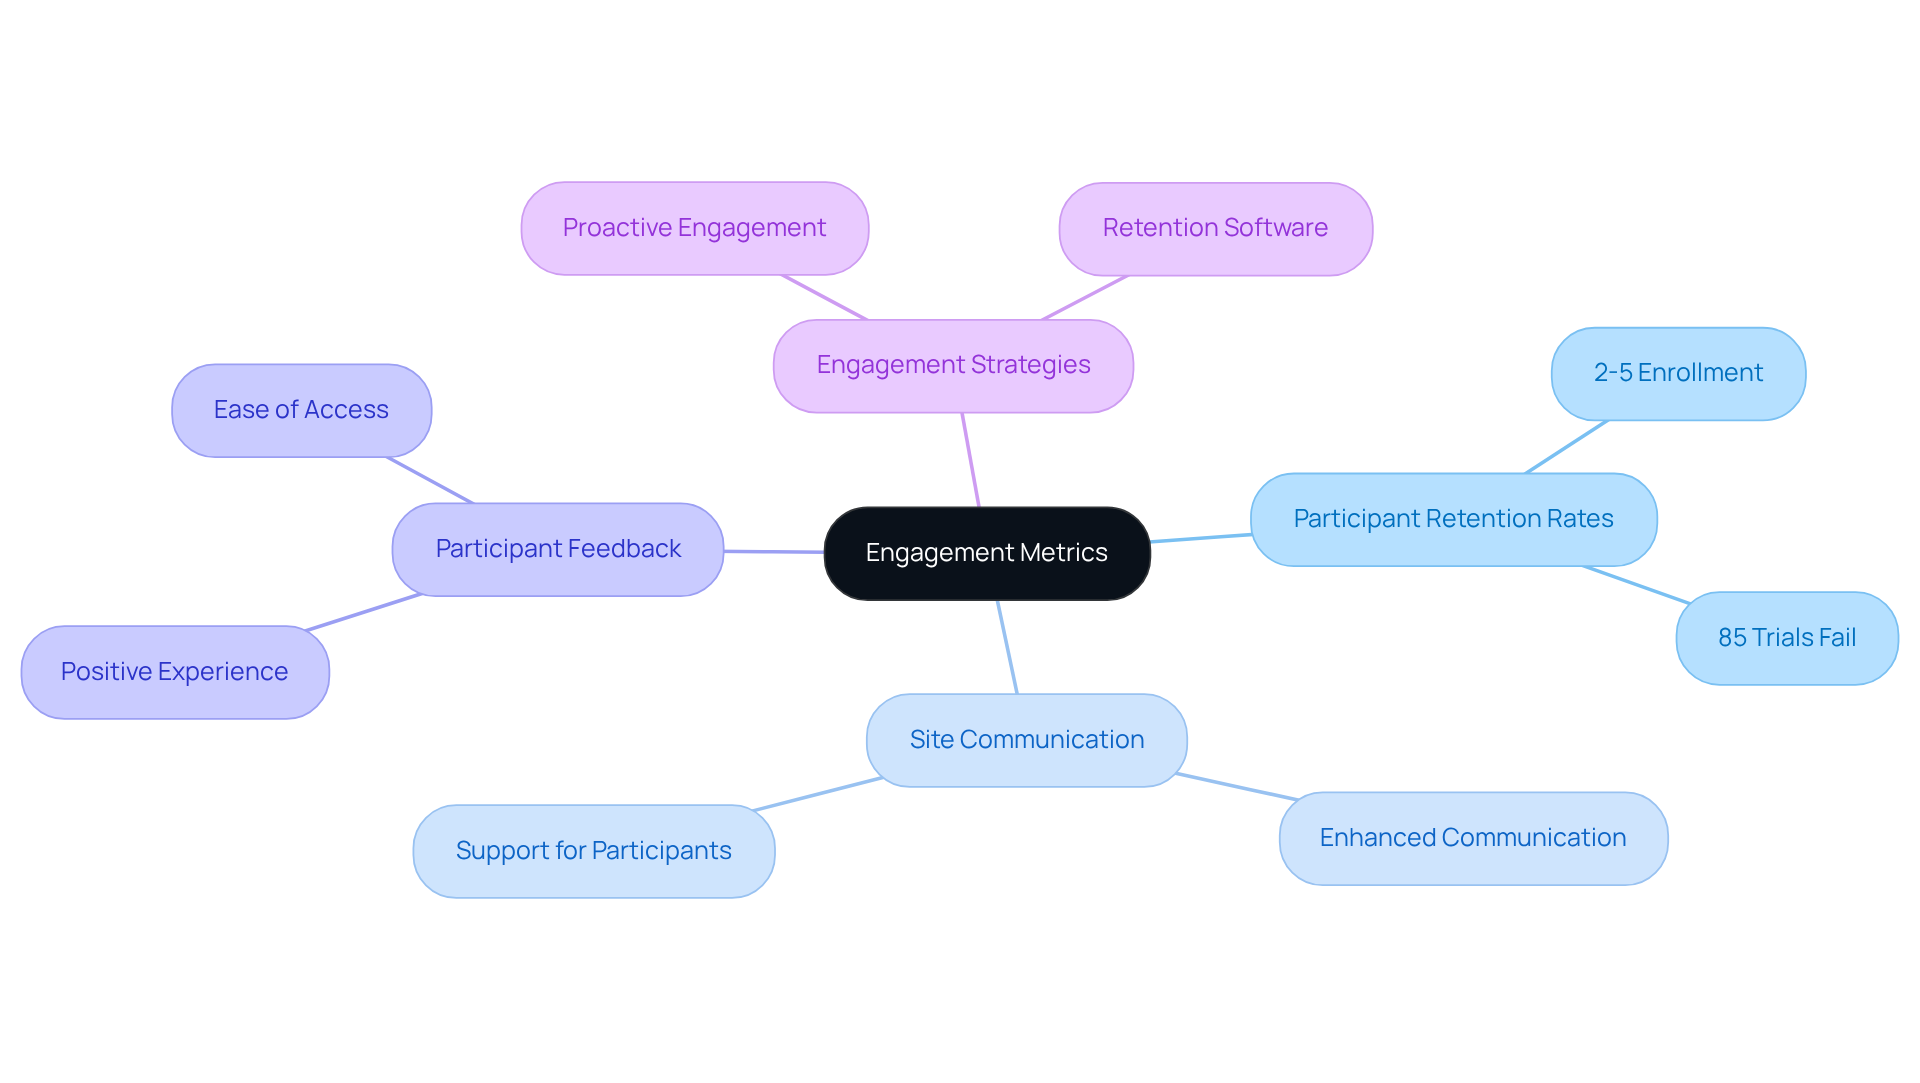
Engagement indicators play a pivotal role in assessing the effectiveness of research studies, including participant retention rates, site communication frequency, and participant feedback. In 2026, current participant retention rates in clinical trials remain a significant concern, with statistics indicating that only 2-5% of patients enroll in trials, and 85% of trials fail to recruit enough participants. This alarming statistic highlights the critical need for improved recruitment strategies. Monitoring these indicators allows for the identification of areas that need improvement. For example, a notable drop in retention rates at a specific site may signal the necessity for enhanced communication or additional support for participants.
Case studies emphasize the significance of engagement measurements in achieving successful results. The Participant Engagement Portal (PEP) pilot project demonstrated that 84% of participants reported a positive experience, with 96% finding the platform easy to access. This underscores the importance of effective engagement strategies in enhancing participant involvement and retention. Additionally, the use of retention software, which aids in maintaining participant engagement through tools like electronic diaries and reminders, has proven beneficial in improving retention rates.
Expert opinions emphasize that proactive engagement strategies, such as regular communication and feedback solicitation, are essential for fostering participant commitment. As the sector develops, concentrating on these engagement indicators will be essential for improving site and participant participation, ultimately resulting in more successful research outcomes. Focusing on these indicators may ultimately redefine the landscape of clinical research.
Data Visualization Metrics: Improving Decision-Making
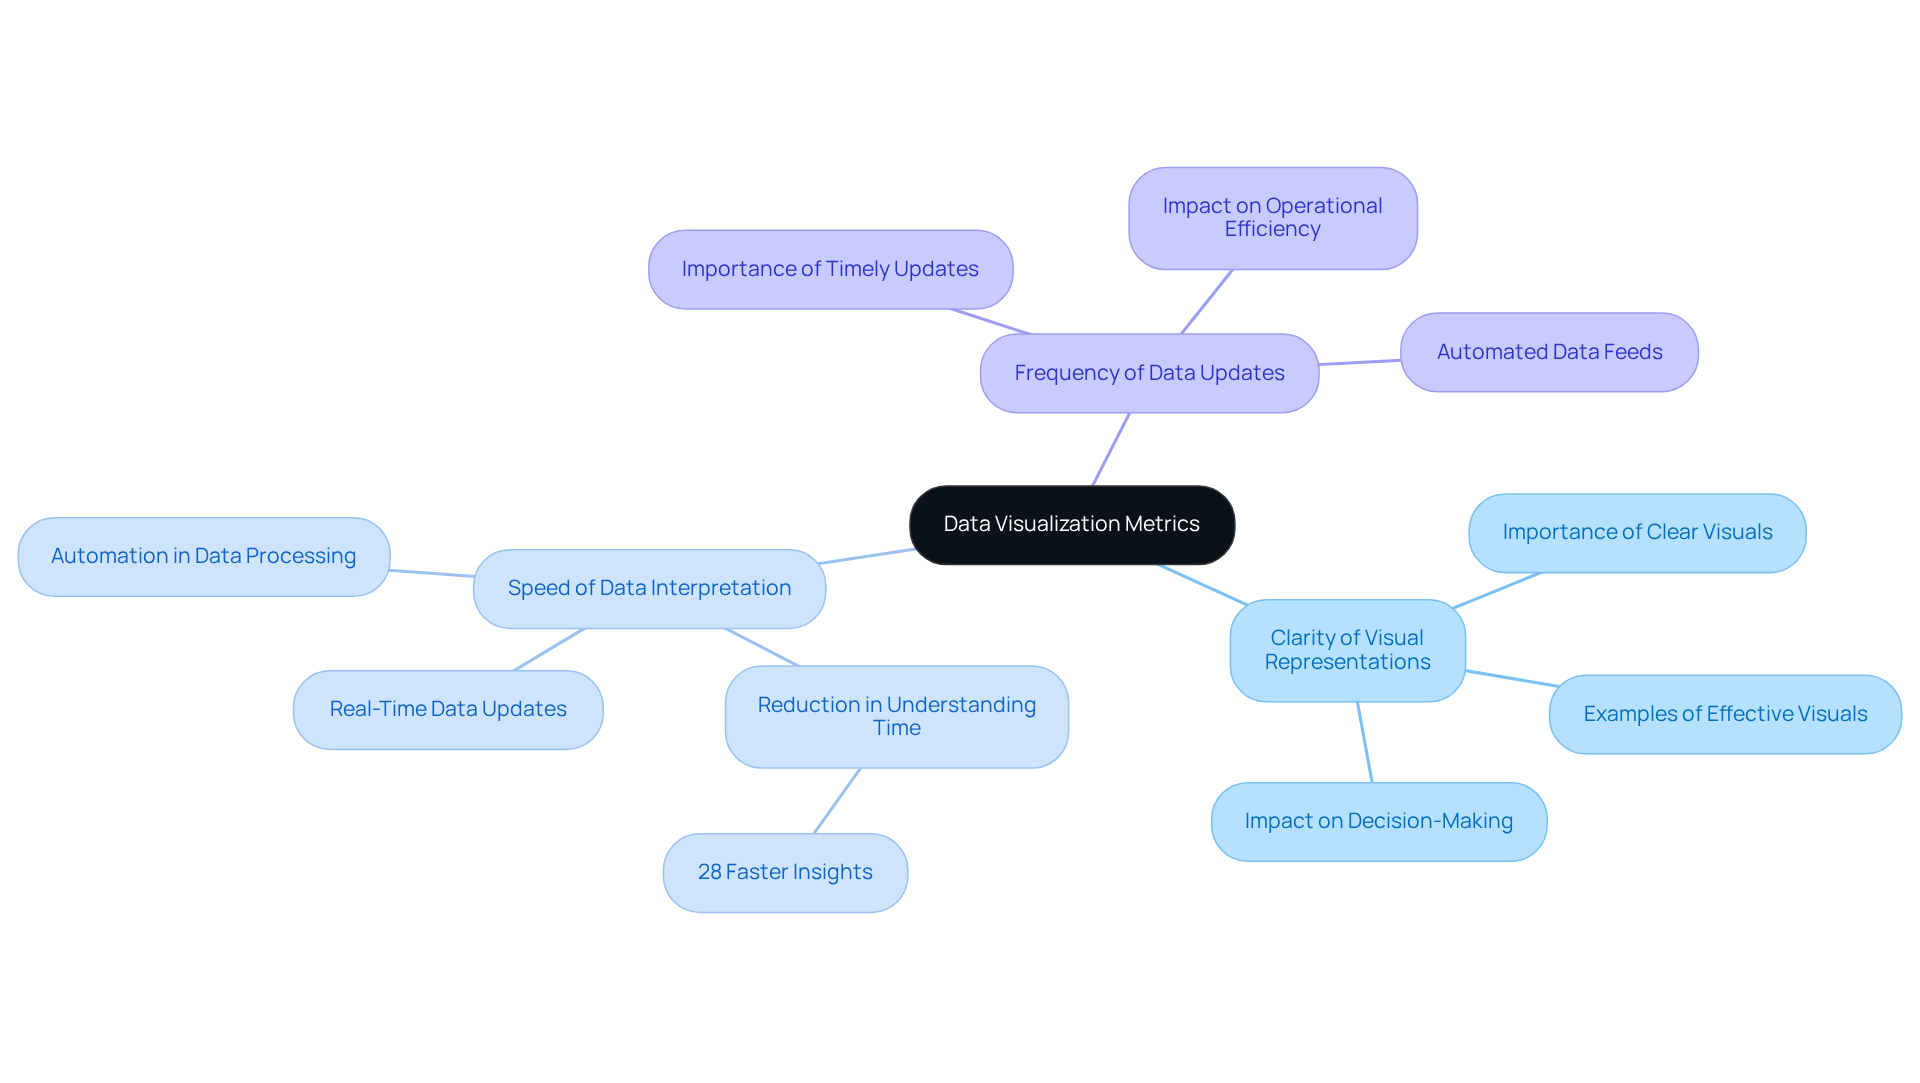
Effective decision-making in clinical studies hinges on the quality of data visualization indicators. Key metrics include:
- The clarity of visual representations
- The speed of data interpretation
- The frequency of data updates
InnovoCommerce's AI-Powered Intelligence enhances the effectiveness of data presentation, enabling swift and informed decision-making. For instance, a recent analysis showed that utilizing AI-driven data visualizations reduced the time needed to understand study status by up to 28%, significantly improving operational efficiency.
Frequent misinterpretation of visualizations indicates a significant barrier to effective decision-making, signaling a need for redesign or additional training for staff on data interpretation. As the sector develops, the incorporation of sophisticated analytics and immediate updates will further enhance these measurements. This improvement allows medical teams to respond more effectively to emerging challenges, ultimately dictating their agility in addressing new challenges.
Compliance Metrics: Ensuring Regulatory Adherence
Effective compliance indicators are crucial for maintaining regulatory standards in clinical studies. Essential indicators include:
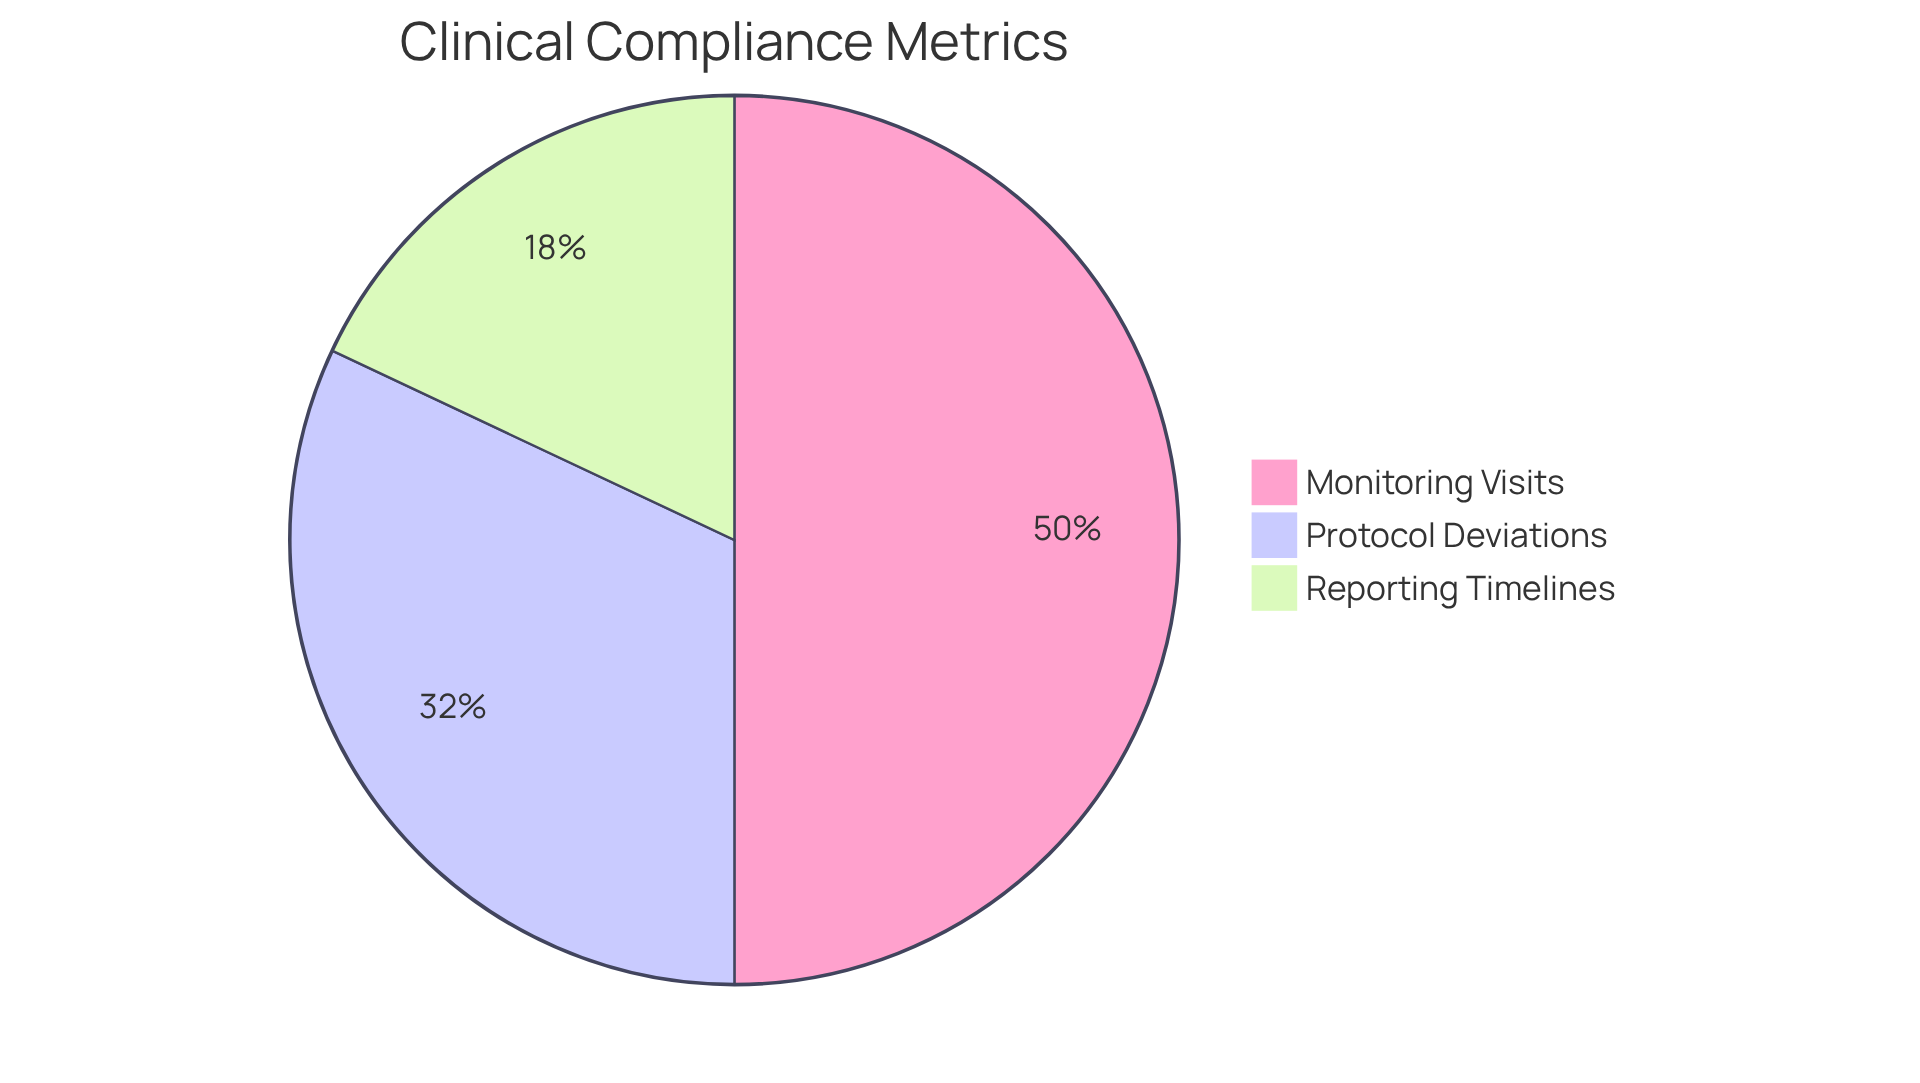
- The percentage of monitoring visits conducted on time
- The count of protocol deviations
- Adherence to reporting timelines
For instance, in 2026, the compliance rate for timely reporting on the Clinical Trials Information System (CTIS) is projected to be 50%, surpassing the 41% rate observed in the United States. By closely monitoring the clinical operations copilot metrics to track, project managers can proactively recognize potential compliance issues and implement corrective actions.
The frequent protocol deviations suggest a gap in training and communication that must be addressed. These deviations can often be prevented through targeted training initiatives, underscoring the need for targeted training initiatives.
InnovoCommerce's integrated site engagement solutions, including StudyCloud and SiteCloud, offer customized eLearning and seamless integration that significantly enhance training efforts. By utilizing these tools, study managers can better address compliance challenges, leading to more reliable study outcomes and participant safety.
Moreover, the FDA's heightened examination of compliance standards emphasizes the necessity for sponsors to uphold strict supervision and transparency in their operations, including the prompt reporting of all deviations. Thus, ensuring rigorous compliance oversight is essential for safeguarding participant welfare and achieving successful study results.
Cost Metrics: Evaluating Financial Efficiency in Trials
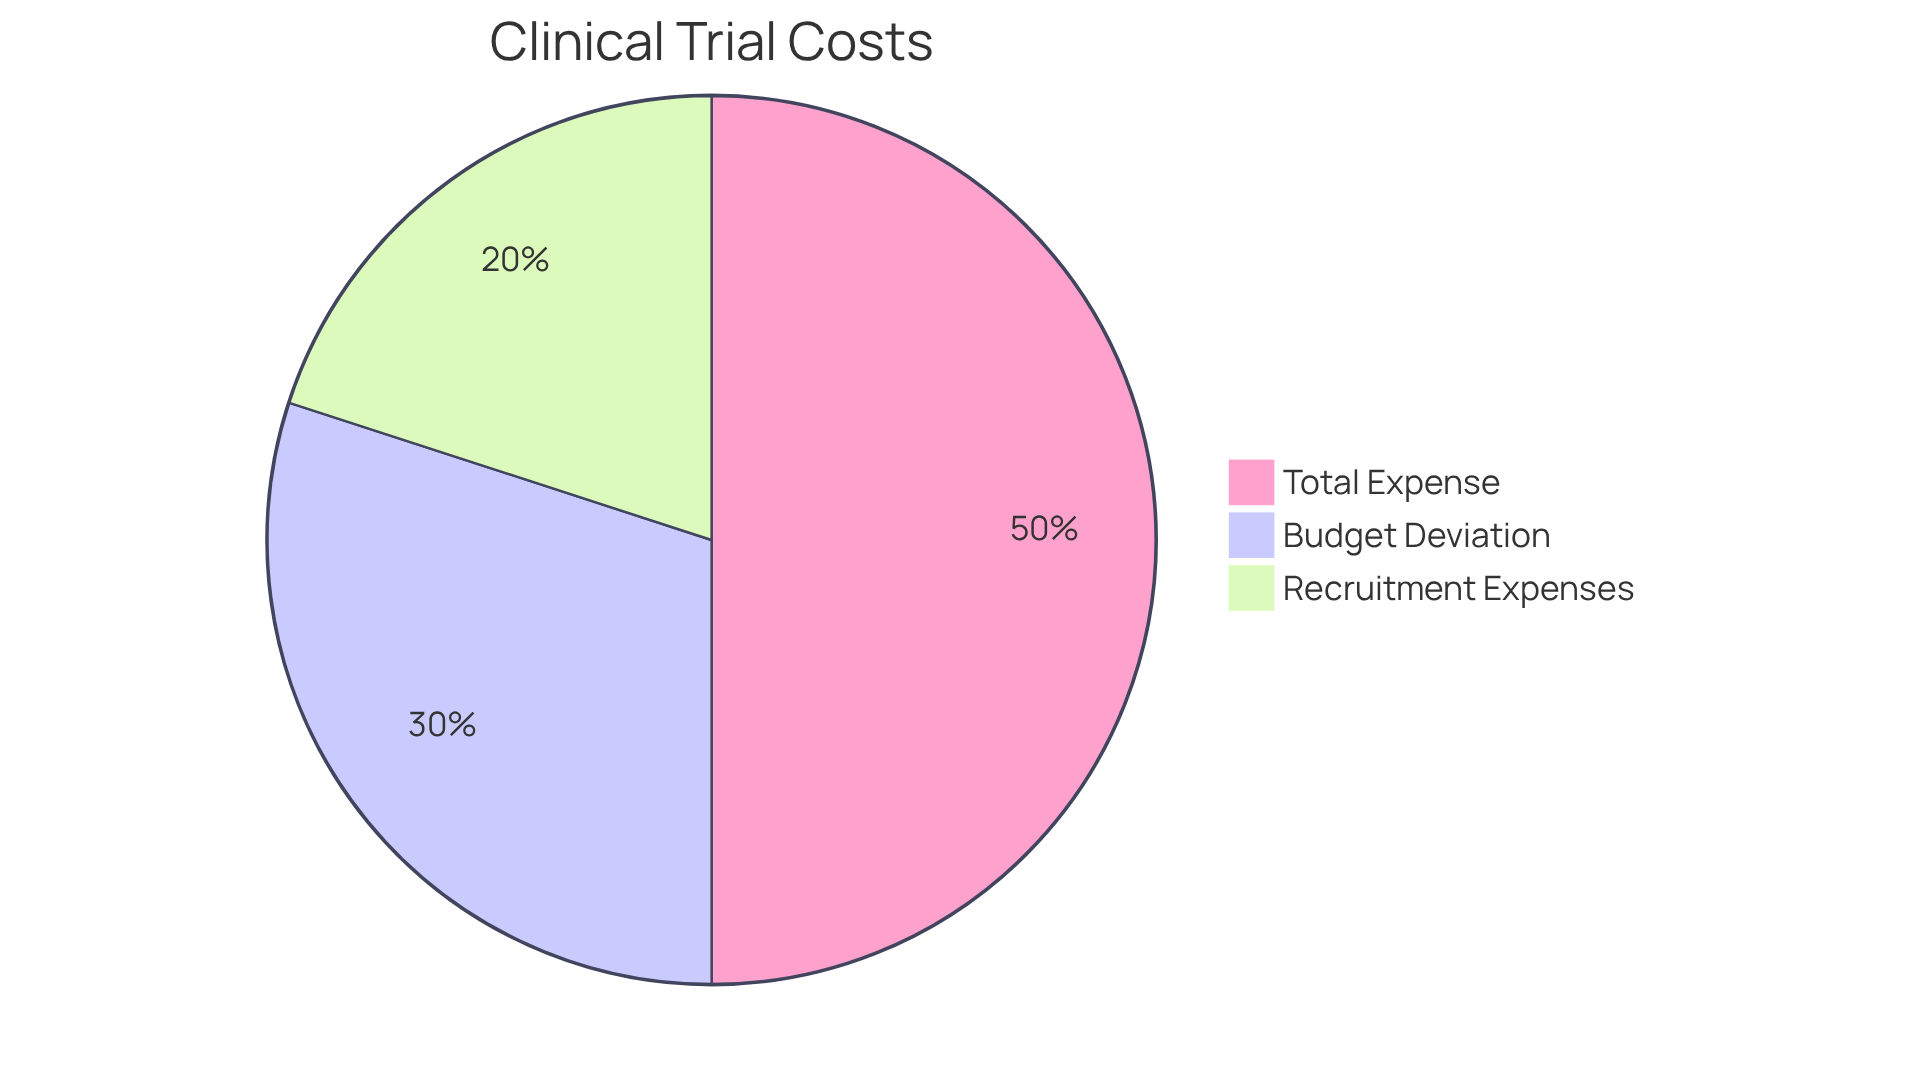
Effective cost measurement is essential for optimizing financial efficiency in research studies. Cost measurements are crucial for assessing financial efficiency, including total expense per patient, budget deviation, and recruitment expenses per participant. In 2026, the average total expense per patient for Phase III studies ranges from $25,000 to $75,000, reflecting the increasing complexity and inflationary pressures in clinical research. However, many trial managers struggle to identify these inefficiencies due to the overwhelming volume of data. By closely analyzing the clinical operations copilot metrics to track, trial managers can identify inefficiencies and uncover opportunities for cost reduction without sacrificing quality. If the cost per patient surpasses industry benchmarks, it indicates potential recruitment issues or the need for site contract renegotiation.
Case analyses show that enhancing recruitment strategies can result in substantial savings. For example, a study demonstrated that leveraging real-world data (RWD) to identify eligible patients improved recruitment efficiency, ultimately reducing costs associated with participant enrollment. Furthermore, industry specialists highlight the significance of monitoring budget discrepancies, as nearly 43% of experimental costs can stay concealed in inadequately monitored start-up activities, totaling around $8.5-9.0 million in a standard Phase III project budget. This oversight can lead to significant financial losses that impact the overall success of the trial.
Incorporating clinical operations copilot metrics to track into trial management practices not only enhances financial oversight but also supports better decision-making, ensuring that resources are allocated effectively throughout the trial lifecycle. Ultimately, neglecting these metrics can jeopardize the financial viability of clinical trials.
Conclusion
The effective tracking of clinical operations copilot metrics is critical for the success of clinical trials. Focusing on key performance indicators - enrollment metrics, study startup efficiency, and compliance rates - enables stakeholders to enhance the overall effectiveness of their research efforts. The integration of advanced technologies, such as AI-driven data visualization and real-world data analysis, empowers teams to make informed decisions that lead to improved outcomes.
Throughout the article, various metrics have been highlighted, including:
- Representative sampling for data quality
- Staff time for resource allocation
- Accrual performance for recruitment effectiveness
Identifying areas for improvement in clinical trials remains a challenge, necessitating a focus on specific metrics. By prioritizing these indicators, organizations can streamline their operations while enhancing participant involvement and confidence.
Ultimately, the importance of clinical operations copilot metrics is paramount. As the landscape of clinical research continues to evolve, embracing a comprehensive approach to tracking and analyzing these metrics will be vital for driving innovation and ensuring the successful delivery of new therapies. Neglecting to prioritize these metrics may lead to inefficient trials and lost opportunities for innovation. Stakeholders are encouraged to adopt these practices, as they are essential for advancing clinical research and improving health outcomes.
Frequently Asked Questions
What is InnovoCommerce and how does it optimize study design metrics?
InnovoCommerce is a platform that addresses the complexities of research design by leveraging advanced metrics and AI technology. It utilizes clinical operations copilot metrics to track and refine research design, focusing on protocol adherence, endpoint clarity, and eligibility criteria.
How does the Innovo Copilot assist in research design?
The Innovo Copilot is a Clinical AI Assistant that leverages real-world data to improve the precision of research designs, aligning them with specific research objectives. It facilitates the bulk generation of study startup packages and provides on-demand answers to study staff regarding training and documents.
What are the benefits of integrating InnovoCommerce with eClinical systems?
Integrating InnovoCommerce with eClinical systems streamlines workflows, enhancing overall efficiency in clinical research operations.
What are key enrollment metrics for tracking recruitment success in clinical studies?
Key enrollment metrics include time to first patient in (FPI) and screen-fail rates, which are critical for assessing recruitment effectiveness.
Why is monitoring time to first patient in (FPI) important?
Monitoring time to FPI is important because sponsors increasingly demand real-time feasibility data before site activation, making it essential for assessing recruitment effectiveness.
What challenges do high screen-fail rates indicate?
High screen-fail rates indicate potential flaws in eligibility criteria, complicating recruitment efforts and necessitating a review of strategies to improve participant engagement.
How can platforms like BEKhealth improve recruitment?
BEKhealth's platform can identify ten times more qualified patients and enroll them at double the speed, effectively addressing recruitment challenges.
What are the key metrics for monitoring study startup progress?
Key metrics for monitoring study startup progress include the average time from protocol approval to site activation and the percentage of sites activated on time.
What is the significance of the average activation time at NCI-designated cancer centers?
The average activation time at NCI-designated cancer centers, which ranged from 78 to 313 days in 2026, highlights the need for improved site selection and communication to mitigate delays, as it far exceeds the recommended target of 90 days.
What are the financial implications of delays in the study startup process?
Delays in the study startup process can lead to substantial financial burdens, as seen in a global Phase III oncology trial that experienced an average site activation delay of 45 days, extending the timeline by six months and incurring an additional cost of $4 million.
How can stakeholders improve trial operations and patient access to new therapies?
By closely observing clinical operations copilot metrics to track bottlenecks, stakeholders can apply strategies to enhance operations, ultimately speeding up patient access to investigational therapies and improving study outcomes.
